© 2000, Annual Reports of the Zoological Institute RAS.
Viktor V. Boulion* & Lars Hekanson**
* Zoological Institute, Russian Academy of Sciences, Universitetskaya nab., 1, St. Petersburg, 199034, Russia
**Uppsala University, Departament of Earth Sciences, Villav. 16, Uppsala, 752 36, Sweden
Prediction of matter flow intensity and water trophic state is the major direction of modern hydroecology. The development of prediction bases is related to the solution of the following tasks.
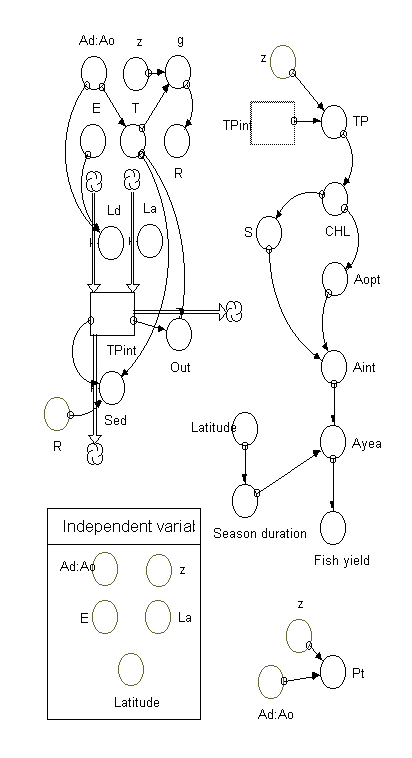
Fig. 1. Simple model for prediction of the intermediate (total phosphorus, chlorophyll, Secchi depth, water colour, photosynthesis rate) and target dependent variables (annual primary production, fish yield) on the basis of independent (or driven) variables (specific catchment area, coefficient of total phosphorus export, precipitation of total phosphorus, latitude). See symbols in Appendix
The studies were carried out with financial support of INTAS (Project 306) and the Russian Foundation for Basic Research (grants 99-04-49614 and 00-15-97825).

Fig. 2. Modelling of the total phosphorus content (1) and annual primary production (2) in a lake located at 60o N at medium other condition: specific catchment area (Ad : Ao) = 10, mean depth (z) = 5 m, coefficient of total phosphorus export from catchment (E) and total phosphorus precipitation (La) = 0.020 ± 0.005 g · m -2 · yr -1 (see Fig. 1 and Appendix). The dynamic equilibrium in total phosphorus content and fish yield is achieved after 4 years.
Trophic status of lake is close to that for mesotrophic water bodies
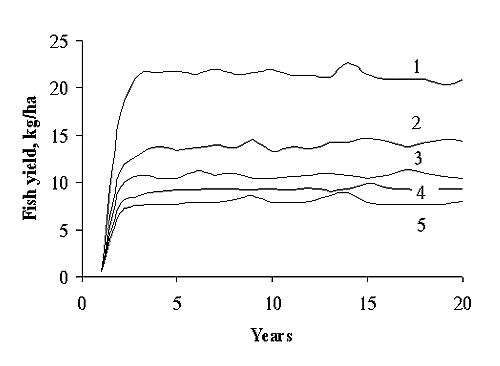
Fig. 3. Dependence the annual fish yield on mean depth (z): 1– 2 m; 2 – 4 m; 3 – 6 m; 4 – 8 m; 5 – 10 m. Latitude = 60o N; Ad : Ao = 10; E = 0.020 ± 0.005 g P · m -2 · yr -1; La = 0.020 ± 0.005 g P · m -2 · yr -1. See symbols in Appendix. The relationships between variables are indicated in Fig. 1 and Appendix
The list of the equations used in the model (see Fig. 1) meant for prediction of the annual primary production and fish yield in lake ecosystems
BOX
TPint(t) = TPint(t – dt) + (La + Ld – Out – Sed) * dt INIT TPint = 0
DOCUMENT: Total phosphorus contents in lake, g 10.0pt">·m-2.
INFLOWS:
La = RANDOM(0.015,0.025)
DOCUMENT: Precipitation phosphorus load, g · m-2 · yr -1.
It is assumed that La = 0.020 g · m -2 · yr -1 and CV = 25%. Ld = Ad:Ao*E
DOCUMENT: Terrestrial phosphorus load, g·m-2·yr -1.
OUTWLOWS:
Out = TPint/T
DOCUMENT: Phosphorus outflow from lake, g · m-2 · yr -1.
Sed = TPint*R/T
DOCUMENT: Phosphorus sedimentation in lake, g · m-2 · yr -1.
VARIABLES:
Ad : Ao = 10
DOCUMENT: Specific catchment area, i.e. the ratio of catchment area to lake area (km2/km2).
Aint = 0.64*(Aopt*S)^1.069
DOCUMENT: Mean-summer areal primary production, mg C · m-2 · day-1 (Boulion, 1997).
Aopt = 30.6*CHL^0.927
DOCUMENT: Mean-summer photosynthesis rate at “optimal” depth, mg C · m-3 · day-1 (Boulion, 1997).
Ayear = Season_duration*Aint/100
DOCUMENT: Annual primary production, kcal · m -2.
CHL = 0.01+0.073*TP^1.451
DOCUMENT: Mean-summer chlorophyll concentration in a lake (according to the equation of Dillon and Rigler, 1974), mgm-3.
To avoid unrealistically low chlorophyll concentrations the constant 0.01 as minimum concentration of the chlorophyll in natural waters is added in the equation.
E = RANDOM(0.015,0.025)
DOCUMENT: Coefficient of phosphorus export in lake, g · m-2 · yr -1.
It is assumed that E = 0.020 g · m-2 · yr -1 and CV = 25%.
Fish_yield = 0.013*Ayear^0.996
DOCUMENT: Fish yield, kg · ha-1 (Boulion, 1997).
g = z/T
DOCUMENT: Hydraulic load, m · yr -1.
Latitude = 60
DOCUMENT: Latitude in oN.
Pt = 25.3*(Ad : Ao/z)^0.639
DOCUMENT: Water colour in lake (according to Boulion, 1995).
R = 0.201*EXP(-0.0425*g)+0.574*EXP(-0.00949*g)
DOCUMENT: Coefficient of phosphorus retention in lake, dimensionless value (Ostrofsky, 1978).
S = 6.01*CHL^ (-0.517)
DOCUMENT: Mean-summer water transparency (Secchi depth) in lake, m (Boulion, 1997).
Season_duration = -0.058*Latitude^2+0.549*Latitude+365
DOCUMENT: Season duration, days.
T = 1/(0.036*Ad:Ao^1.316)
DOCUMENT: Water retention time, years.
According to Kitaev (1984).
TP = 1000*TPint/z
DOCUMENT: Total phosphorus concentration in lake, mg · m-3.
z = 5
DOCUMENT: Mean depth, m.
Boulion, V.V. 1994. Zakonomernosti pervichnoi produktsii v limnicheskikh ekosistemakh [The regularity of primary production in limnetcic ecosystems]. St.-Petersburg, Nauka. 222 pp. (In Russian.)
Boulion, V.V. 1995. Reconstruction of phosphorus budget of two Karelian lakes of different type. Hydrobiol. Zh. 31: 3-14. (In Russian.)
Boulion, V.V. 1997. Regularities of the plankton primary production and their importance for the control and prediction of a trophic condition in water ecosystems. Biol. vnutrenn. Vod 1: 13-22. (In Russian.)
Dillon, P.J. & F.H. Rigler. 1974. The phosphorus-chlorophyll relationship in lakes. Limnol. Oceanogr. 19: 767-773.
Hekanson, L. 1996. A new, simple, general technique to predict seasonal variability of rive discharge and lake temperature for lake ecosystem models. Ecol. Modelling 88: 157-181.
Hekanson, L. 1999. Water pollution - methods and criteria to rank, model and remediate chemical threats to aquatic ecosystems. Leiden, Backhuys Publ. 299 pp.
Hekanson, L. & L. Carlsson. 1998. Fish farming in lakes and acceptable total phosphorus loads: calibrations, simulations and predictions using the LEEDS model in Lake Southen Bullaren, Sweden. Aquatic Ecosystem Health and Management 1: 1-24.
Hekanson, L. & R.H. Peters. 1995. Predictive limnology. Methods for predictive modelling. Amsterdam, SPB Academic Publ. 464 pp.
Kitaev, S.P. 1984. Ekologicheskie osnovy bioproduktivnosti ozer raznykh prirodnykh zon [Ecological principles of productivity of the lake of different natural zones]. Moskva, Nauka. 207 pp. (In Russian.)
Ostrofsky, M.L. 1978. Modification of phosphorus retention models for use with lakes with low areal water loading. J. Fish. Res. Bd Can. 35: 1532-1536.